Financial overview
Related content
Investors
Investing in ASML is investing in the future. Read our financial results and strategy for growth in the semiconductor industry.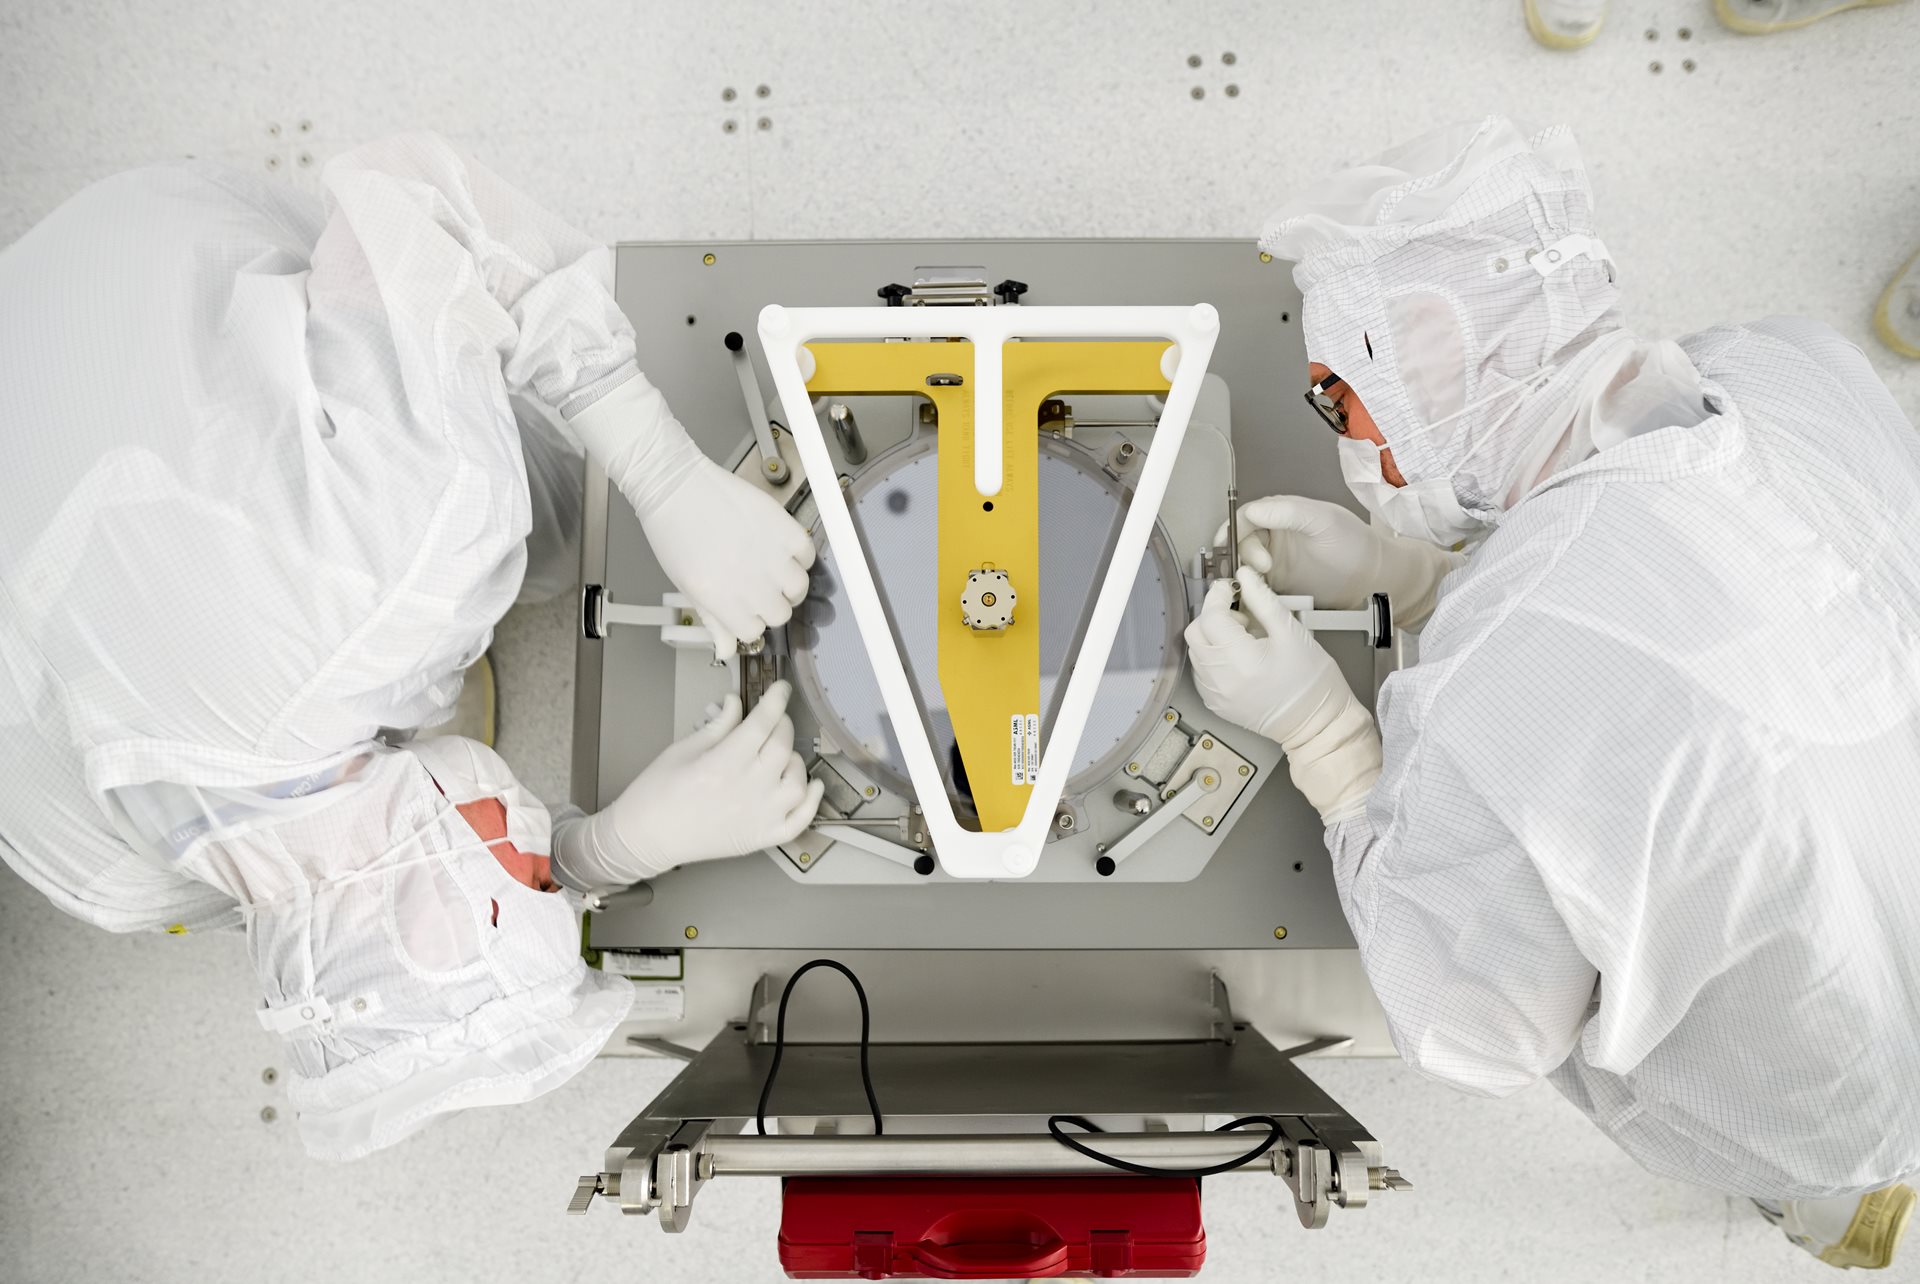
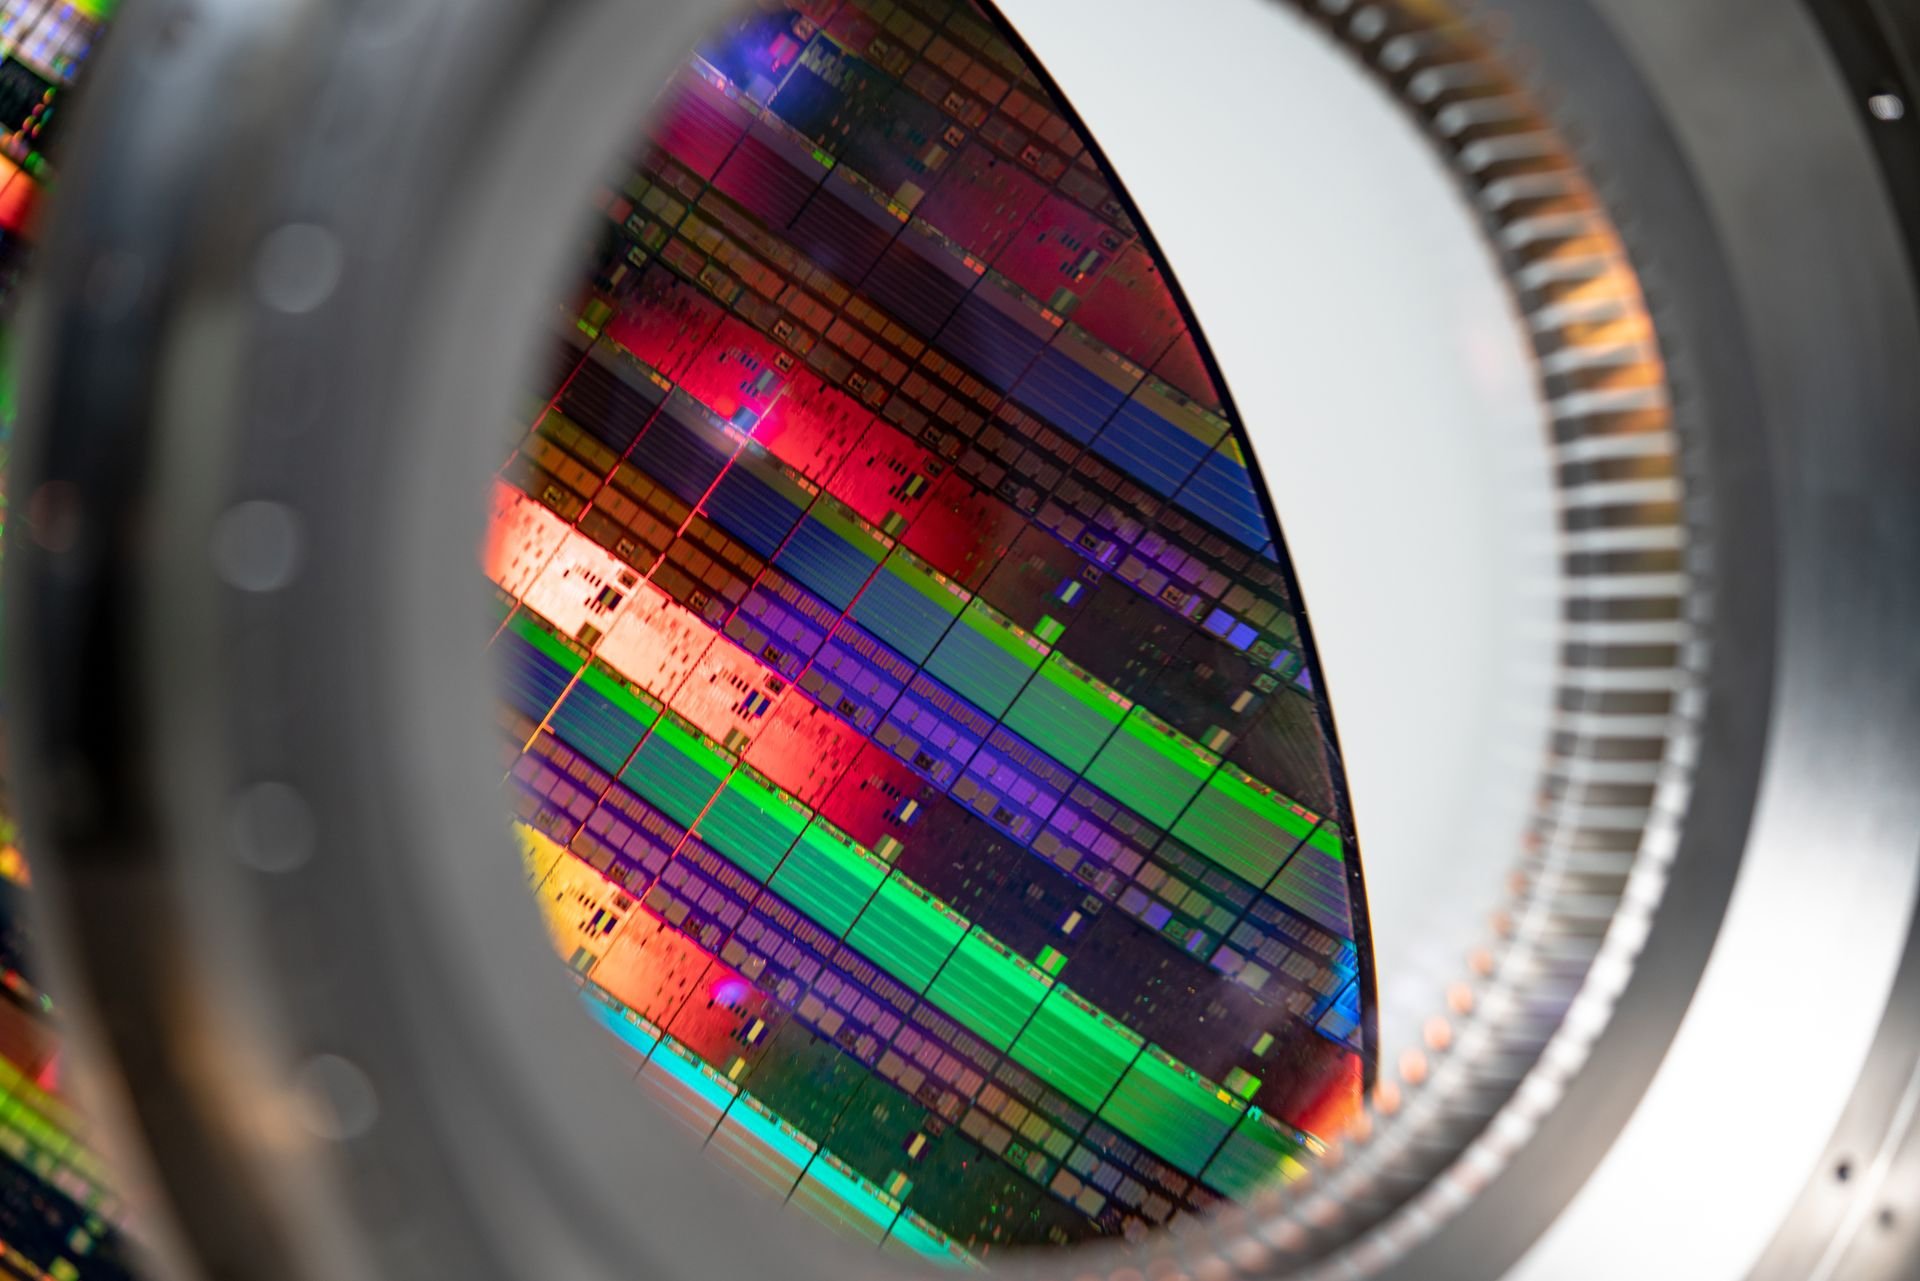
Technology
Learn about the technology behind our lithography, metrology and inspection, and software solutions.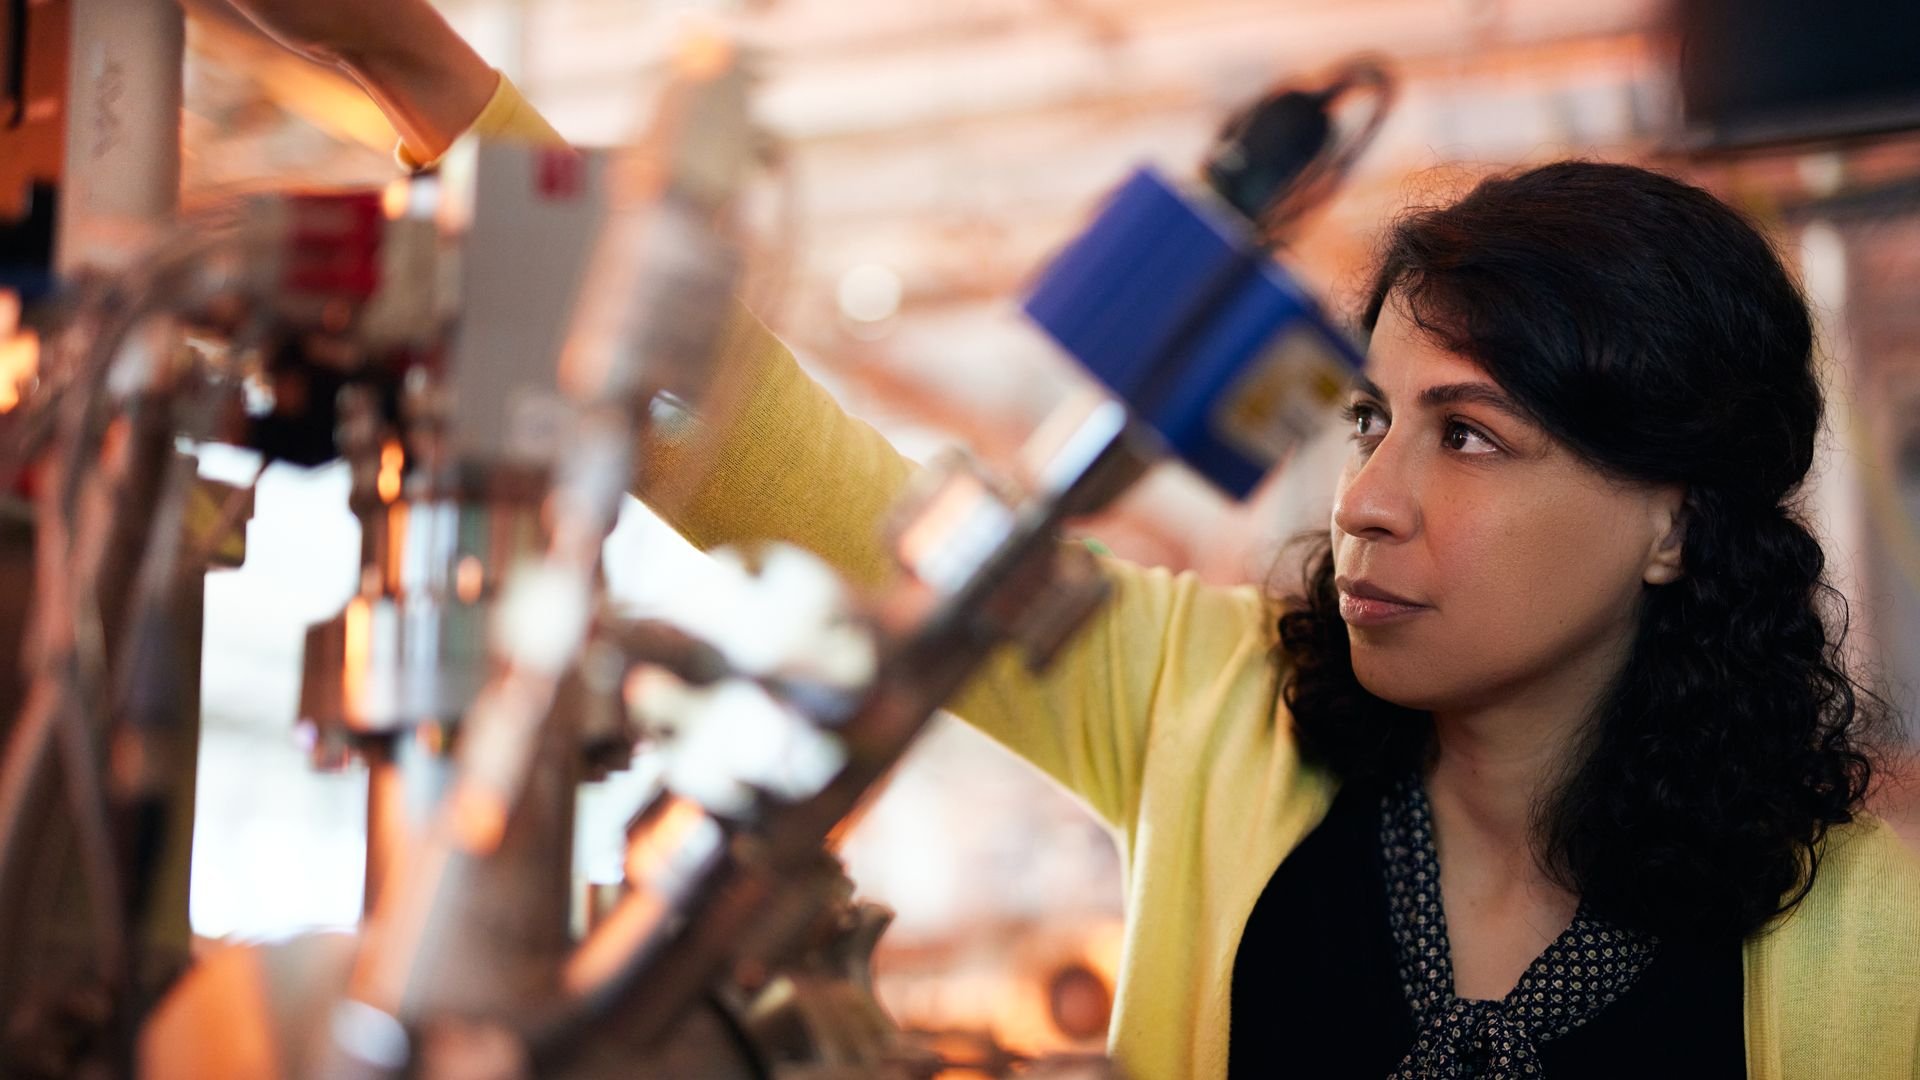
Careers
Explore careers at ASML and join the high-tech semiconductor industry, where you can work on technology that can change the world.