7-minute read - by Sander Hofman, June 11, 2021
The legendary Brazilian player Pele described soccer as 'the beautiful game'. The dynamic forward was fluid, unpredictable and lucky, just like the game itself. And while luck plays a significant role in the outcome of a soccer game, the action on the pitch is certainly quantifiable. So, can serious number-crunching turn the odds in one's favor? ASML and soccer club PSV joined forces off the pitch in order to improve performance on the pitch – sheer luck aside, that is.
Most professional sports teams use a host of statistics to evaluate their games and players. Especially since the publication of Michael Lewis' 2003 book (and later, movie) Moneyball, the role of data in sports has been of make-or-break importance to a team's aspirations. But Moneyball is about baseball, a game of discrete events: brief, well-defined and self-paced actions with a clear beginning and end. Soccer is different. It is a much more continuous game, where players have to constantly adapt to changing circumstances on the pitch – making it a less obvious candidate for data-driven analysis.
"In fact, an estimated 31% of the outcome of a season is based on luck," says Ruud van Elk, head of sports science and analytics at PSV soccer club. "Our job is to try and control the other 69%."
Measure, analyze, improve
Control for performance starts with data. Professional soccer clubs in the Netherlands work with two key data sets: event data and tracking data. The event data is a manual log of sequential activity of the ball on the pitch, in simple terms, player A passes the ball to player B, which usually leads to around 2,000 rows of data per soccer match. The tracking data is an automated log of the position of each player and the ball on the pitch, measured 25 times per second, which means that it's much richer and more contextual than the event data. Specialized cameras in the stadium capture a staggering four million rows of data per match.
"We worked with both types of data separately," Ruud says. "It allowed us to pull up basic things like total distance traveled per player, passes per player, shots on goals. But to see the complete picture, you need to combine and visualize the data as a whole. Not many sports teams have the expertise to do this properly. That's why we looked to our Brainport partners for support."
Enter ASML.
Or more specifically, ASML's Big Data Analytics department. With over 300 people, it supports ASML's R&D and corporate functions with advanced analytics on lithography machine data, operational data and corporate data.
Rob Beeren, who heads ASML's corporate analytics group, recalls first learning about PSV's ambitions. "ASML is part of PSV's Brainport partnership. At a knowledge sharing event in 2020, PSV presented their future vision for the club. Boosting performance through data analytics was a key part of this vision. We realized that we could help and learn from each other by applying ASML's analytics expertise in PSV's high-performance sports environment."

Rob had a special team in mind for the job: the Innovation Lab, a specialized group of six data scientists within ASML's Big Data Analytics department that focuses on experimentation, fast learning and rapid prototyping. Led by Diederick Edel, the team was asked to sit down with PSV and see where opportunities for collaboration were.
"The PSV staff were a little bit apprehensive at first," says Diederick. "They were uncertain about what joint prototyping would be like with a high-tech company like ASML, and whether it would actually generate the results that they were looking for. But we put our 'less talking, more doing!' philosophy to work. The ASML-PSV team jointly sketched out the ambitions and the way to get there."

Combining data for new insights
A first crucial step in the collaboration was to try and bring all available data sets together. That challenge landed with Maud Diepstraten, data scientist with the Innovation Lab.
"With any data project, it's crucial to really understand the data and get familiar with what you have – or don't have. For example, capturing event data manually meant that it was prone to typos or missing values. It's something you have to somehow work with," Maud says.
It was also a challenge to perfectly match the manually-logged events on the pitch to the automated tracking data. Maud: "For example, the timestamps for passes just didn't line up correctly. We solved it by matching the timestamp when the ball is closest to a player in a 1.5 second timeframe."
As an Applied Mathematics graduate with a Data Science Management degree in the works, Maud enjoys making sense out of huge data sets. But this particular project offered a special personal perspective, because Maud is also a midfielder at local soccer club Beerse Boys.
"Working with this data was a bit of a break from the norm for me. I usually work with the very abstract data that comes out of ASML's machines. But with soccer data, I can actually imagine what's going on with 22 players on the pitch."
Combining multiple files with various formats, Maud laid the foundation for visual analytics in PSV’s preferred data analytics platform, Tableau. The team saw quick results.
A sprint about sprinting
“We decided to test our new data set by looking at a specific aspect of the game: sprinting,” says Ruud. “Before, we had data on just the start and the end points of all sprints of a player over the course of the game. But a sprint is so much more. There’s direction, acceleration, speed, turns.”
The team iterated in fast scrum cycles to deliver a Tableau visualization based on the aggregated data set, getting Ruud’s feedback and tweaking the product on-the-go. Within two weeks, a sprint visualization was in the hands of PSV’s performance trainers.
Ruud: “Being able to visualize all of this, it’s massively important to understand how we should actually train sprinting for individual players.”
The ASML-PSV team proved the value of their collaboration with the sprint analytics and got the go-ahead to up the ante.
Maud: “The real fun starts when you add complexity and granularity to the data. Together, we decided to create an advanced algorithmic model that could help PSV understand how the team controls the pitch throughout the game.”
Modeling pitch control for PSV
Using the raw tracking data as the foundation for the model, the team calculated pitch control by understanding where every player was at a specific timestamp, where they were going and how fast they were moving. “We defined pitch control as which player controls which part of the pitch at any one time. So by projecting a grid on the pitch, we can calculate which player will reach a particular cell fastest or first,” Maud explains. “Calculating that for each grid cell, we can visualize the overall pitch control of a team.”
Calculation pitch control for all grid cells at 25 frames per second requires some heavy-duty computing power. The ASML team worked with PSV on the back-end infrastructure, a powerful combination of Azure, Microsoft's cloud computing platform used by ASML, and Tableau.
Diederick: "We rebuilt PSV's analytics environment within a day to do the calculations on Azure. We offloaded the pitch control calculations to the massive computing power of Azure Databricks."
To feedback that computing power to Tableau, the team connected the environments through Azure Synapse. This enabled the PSV performance trainers to analyze tens of millions of rows of data in the platform that they were already familiar with.
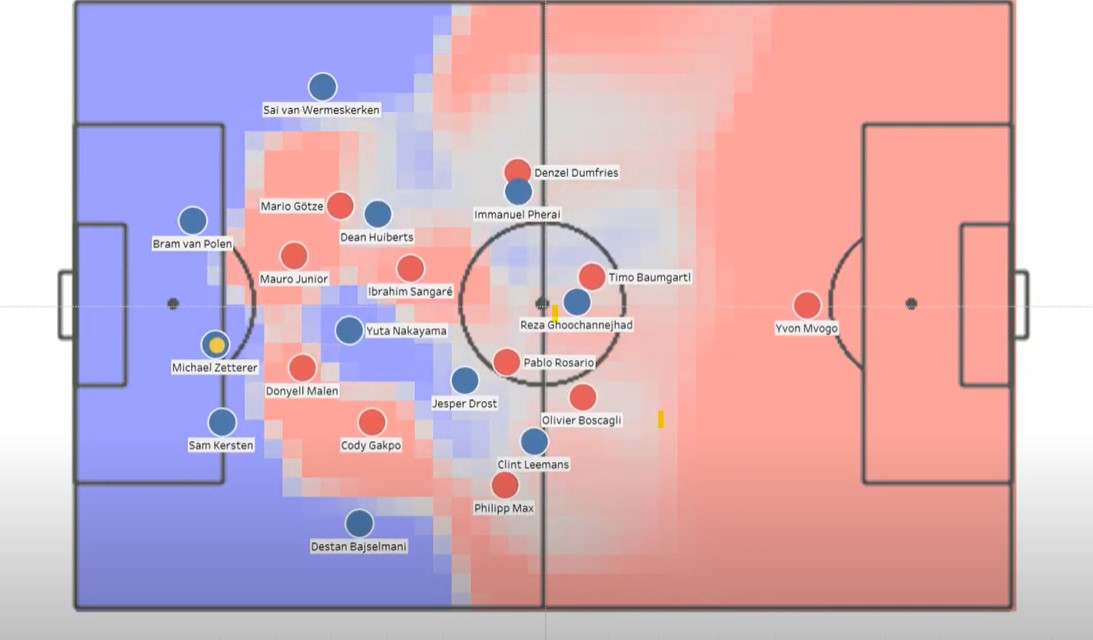
"Working with this pitch control model is pretty unique for Dutch soccer," Ruud says. "It's something that we're looking to leverage in our training, but we also see possibilities to add even more value. For example, we tried to link pitch control to certain events to understand how a pass influences pitch control."
Ready for more after a running start
Reflecting on this collaboration, the ASML-PSV team is proud. Rob commends the agility and speed of the cross-organizational project. "We pushed ourselves and PSV to really commit to something unique – and to make fast progress on it. The team on our end was also really excited to work with PSV, many colleagues are also fans. That meant high energy all around!"
PSV was impressed by the speedy progress, as Ruud confirms. "The whole project and all deliverables took just three months. To get these results in such a short time contributes to our dream for the future of PSV."
The team is ready for more and wants to industrialize what's already there, so that PSV's performance trainers will receive automated reports after each match. The team is also actively investigating new use cases that match PSV's ambitions.
Diederick is also looking ahead with high hopes: "At ASML, we know that the field of data science is evolving rapidly. The potential is pretty much endless and we'll have to make smart choices for the best results and highest impact. If you ask me, we're just getting started."
